Enova Energy
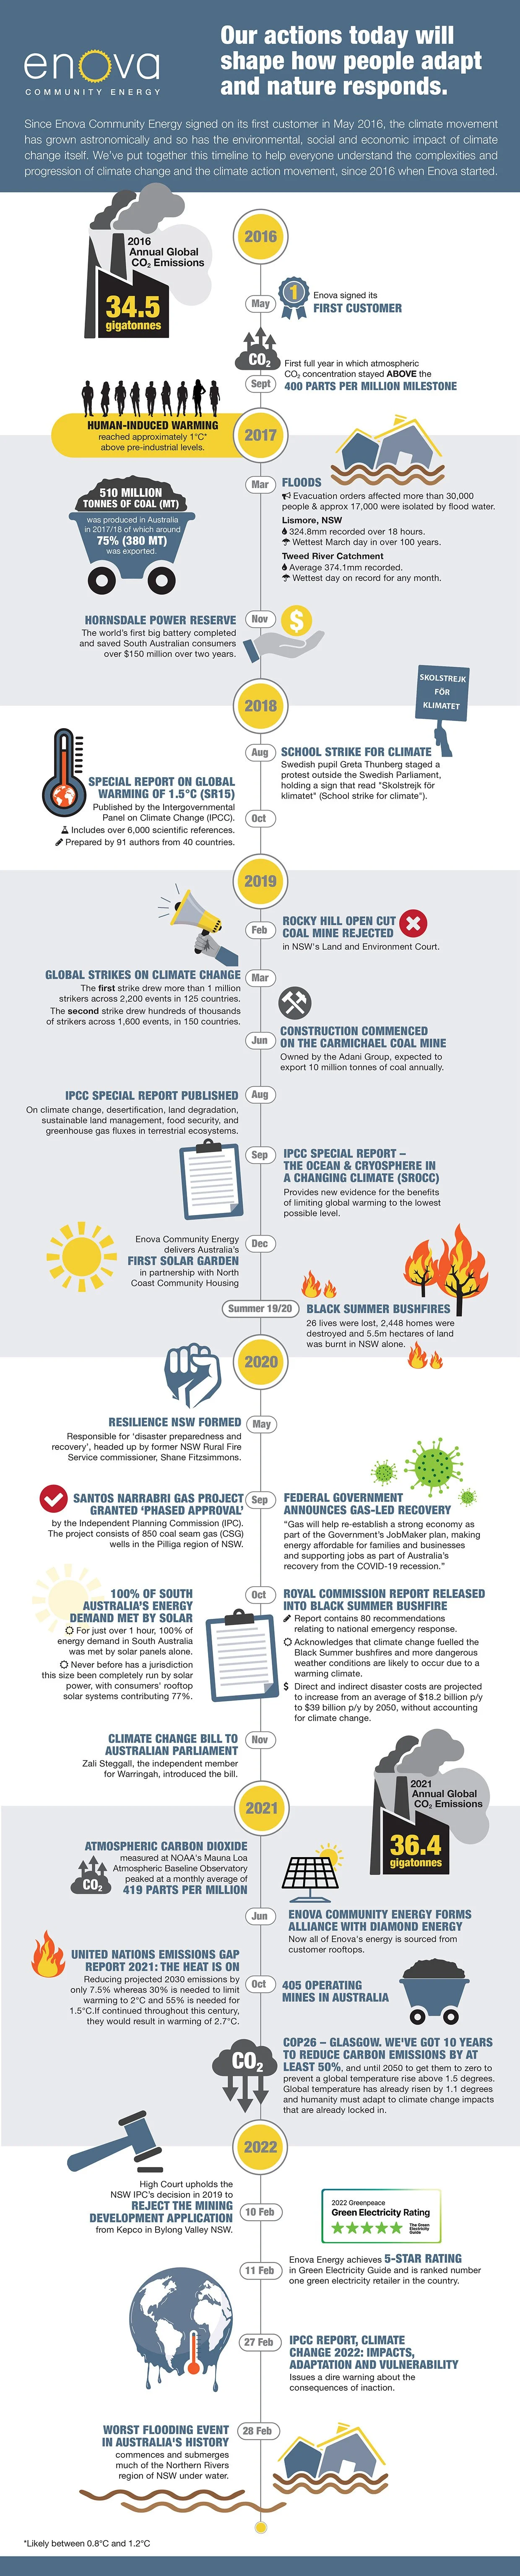
Climate change timeline infographic design for Enova Energy, visualising the progression of climate action and environmental awareness since 2016.
I designed a structured data visualisation that simplifies complex information into a clear, engaging timeline format, helping communicate key milestones in the climate action movement. The infographic was developed to support public understanding and strengthen Enova’s ongoing educational content.